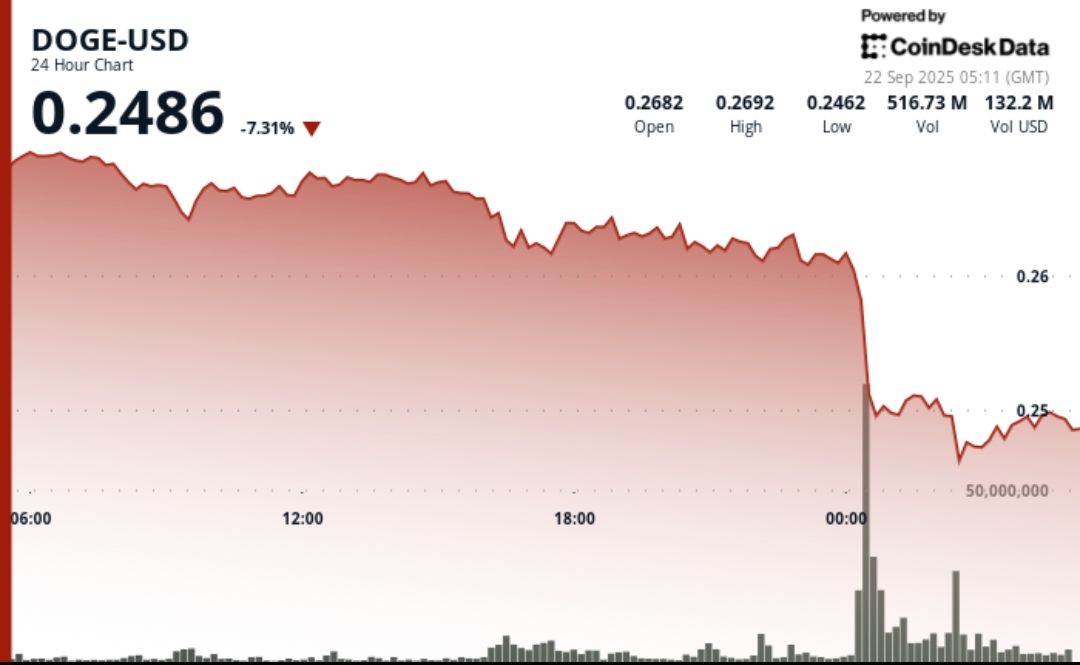
Dogecoin experienced a sharp decline from $0.27 to $0.25 amid record trading volumes, with technical patterns suggesting a potential breakout above $0.28–$0.30 if buying resumes. Traders are watching support at $0.25 and resistance at $0.27, amid broader market uncertainties and institutional activity.
XRP failed to break the $2.3 resistance level amid mixed signals: on-chain accumulation suggests potential for a rally, but declining trading volume and weak network activity indicate caution. Technical analysis shows a bullish weekly trend but ongoing resistance at $2.27-$2.32, with some signs of increasing bullish momentum in the short term.
Bitcoin's short-term price action hinges on whether whale accumulation can sustain momentum to break above $106.2K resistance, amid signs of overvaluation and weakening momentum indicators. The behavior of different holder cohorts and on-chain metrics suggest a critical juncture where a breakout or reversal could occur, influenced by whale inflows and market sentiment.
Dogecoin is testing a critical resistance level at $0.43, showing signs of potential explosive growth. Technical analysis by Coinvo suggests a monthly breakout could lead to a significant rally if DOGE can hold above this level. However, failure to break through could result in a correction. The meme coin's current consolidation phase may be setting the stage for a major move, with key resistance levels at $0.44 and $0.48 being crucial for confirming a bullish trend.
Ripple's XRP has surged past the $2 mark, currently trading at $2.73, and is facing resistance at $2.50 and $2.75. Analysts suggest that if XRP can break these levels, it may target $3, a significant psychological and Fibonacci resistance point. In case of a pullback, support levels are identified at $2 and $1.60.
Ethereum has broken above the $3.1k resistance level, now turned support, but faces a bearish market structure and low trading volume. Despite positive sentiment and a recovering spot CVD, the daily RSI and CMF indicate bearish momentum. For ETH to target the $3.5k-$3.7k resistance zone, increased volume and sustained bullish trends are necessary.
Bitcoin is poised to reach a new all-time high, with a target of $79,000 based on technical formations and recent price dynamics. The market is showing bullish momentum, with signs of underlying buying pressure and sustained positive momentum. Traders are advised to await a definitive push above the current all-time high for bullish entry points and to stay cautious as the market approaches significant resistance levels. Short sellers are cautioned to hold their positions, as stop orders being triggered above the all-time high could fuel a further surge in price.
A bullish reversal in gold prices triggered a sharp advance, testing resistance around the 2,009 interim swing low, with potential for higher prices in the coming days as long as gold stays above 1,990. The recent volatility spike and bullish breakout indicate buyers taking control, with key upside pivot areas at 2,015, 2,024, and the 50-Day MA at 2,031. A breakout above the 50-Day line could signal a completion of the current correction and lead to a bullish trend.
Natural gas experienced a breakout rally, surging to a 78.6% Fibonacci retracement and reaching a high of 3.39, indicating a potential shift in bearish trends. The bullish price action suggests a possible failure of the previous bearish flag breakdown, with a 49.8% increase in price over 17 days. However, signs of resistance at the current high may lead to a short-term pullback, possibly testing support levels at the 38.2% Fibonacci retracement and the 50-Day MA.
Natural gas shows signs of a possible bullish reversal as the current day's trading range exceeds the prior day's high, indicating strength within a downtrend. The relative strength index (RSI) has reached an extreme overbought condition, suggesting a potential continuation to the upside. Yesterday's low completes a significant correction, setting the stage for a potential rally. To advance higher, natural gas needs to recapture the weekly high key of 2.49 and test prior support areas as resistance. The minimal target price for a rally is the 38.2% Fibonacci retracement at 2.77. The completion of an extended falling ABCD pattern at 2.22 acts as support, making a rally the most likely scenario for natural gas.
Gold triggers a bullish reversal after a false bearish signal, surging to its strongest rally since October. The reaction off the bottom suggests the completion of the current retracement, with potential for a breakout to new record highs. Investors and traders are advised to watch retracements for new entry setups. Possible resistance areas include 2,040, 2,052, and 2,070 to 2,082. The failed bearish trend continuation and strong demand indicate bullish signs, but a short pullback or consolidation phase may be needed before sustaining upward momentum into new highs.
Natural gas falls to a new trend low but finds support and rallies back above the prior trend low, signaling a potential bullish one day candlestick pattern. The decline captures all prior price action, and if today's low can sustain support, a rally back to test prior support levels as resistance could come soon. However, bearish signs remain as natural gas continues to close below the long-term downtrend line, reflecting underlying weakness in demand. Strength will be indicated on an advance above today's high, with potential resistance levels at 2.425 and 2.49, while a more significant price zone is around 2.88.
Bitcoin (BTC) experienced a significant dip in price, falling to lows of $40,200 after the weekly close. As BTC attempts to recover, traders and analysts are closely watching key support and resistance levels. The Bollinger Bands indicator suggests that the recent correction was a necessary reset and that support may hold going forward. Large-volume traders are showing signs of "buy the dip, sell the rip" behavior, with institutional-sized bids potentially returning. However, there is uncertainty as to whether these buyers are accumulating or simply taking advantage of price fluctuations. Major support is seen around $38,000, while resistance levels are at $43,850 and $46,400. Analysts believe Bitcoin will establish a new range before the end of the year.
Gold prices are climbing and challenging technical resistance due to falling US yields and a weaker US dollar. XAU/USD has risen over 8% since October, surpassing its 200-day moving average and the $2,000 level. To confirm further upward momentum, a clear move above the $2,010/$2,015 resistance zone is needed. A breakout could lead to a rally towards $2,060 and $2,085. On the downside, support levels are at $1,980 to $1,975, with a potential retreat towards the 200-day moving average at $1,950. Meanwhile, AUD/USD has broken above its 200-day moving average and is close to overcoming resistance at 0.6600-0.6620. A move above this level could push prices towards trendline resistance at 0.6670 and 0.6815. On the downside, support is at 0.6525, with further losses possible towards the 100-day moving average at 0.6460.
Gold markets have surged during the week, bouncing from key support levels. However, as the market approaches the $2000 region, resistance is expected. The bond markets in the US continue to offer higher rates, which may limit gold's upside potential. Geopolitical concerns could provide a boost to the gold market, but there is significant resistance between the $2000 and $2100 levels. Short-term back and forth trading is likely, making it challenging for longer-term traders to find clarity.