NASA opens 33-year weekly sea-level data to public, revealing faster rise and regional shifts
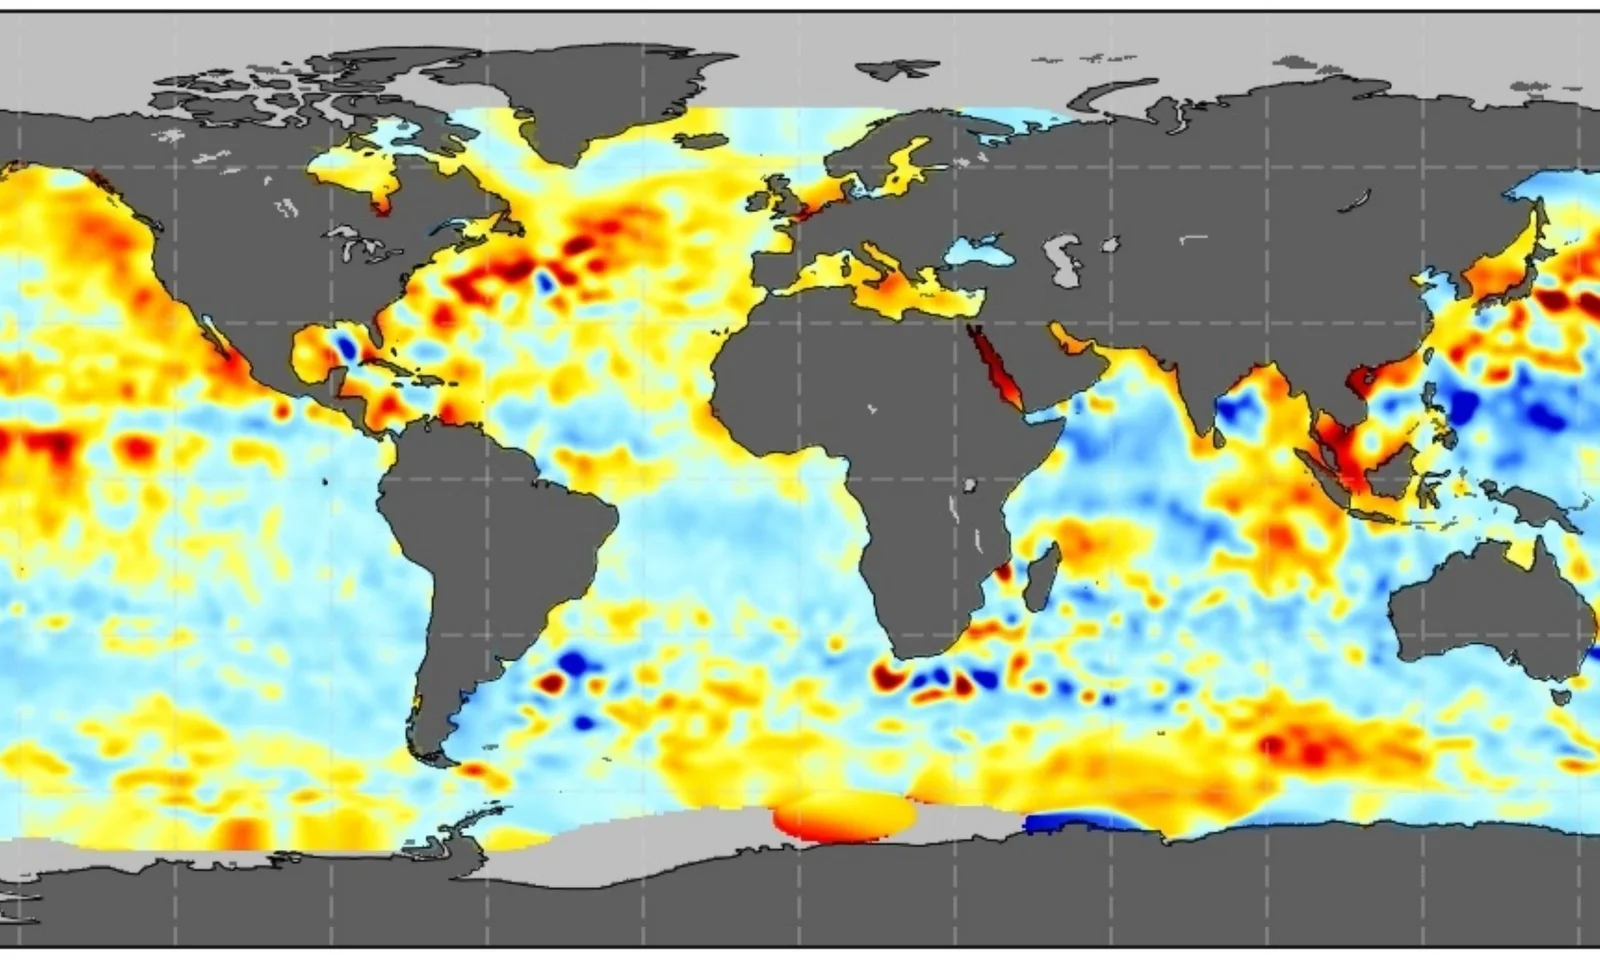
NASA has published 33 years of weekly sea-surface height maps from NASA-SSH, showing where the ocean surface sits above or below the long-term average to aid coastal risk monitoring. The data—derived from radar-altimeter measurements and gridded for comparability—reveal El Niño-driven swings and rapid local changes, but are anomalies with a two-week processing lag and coarse resolution (roughly 200 miles per cell). Long-term trends show accelerating sea-level rise, from about 0.2 cm/year in 1993 to about 0.46 cm/year in 2023, with 2024’s rise largely due to thermal expansion (~0.58 cm/year). The dataset supports research and planning but must be used with tide gauges, as local flooding depends on land motion and tides; NASA plans to extend the record and develop tools to translate anomalies into practical risk checks.
Reading Insights
1
10
17 min
vs 18 min read
96%
3,480 → 127 words
Want the full story? Read the original article
Read on Earth.com