Tariffs and a High CAPE Signal Possible S&P Downturn
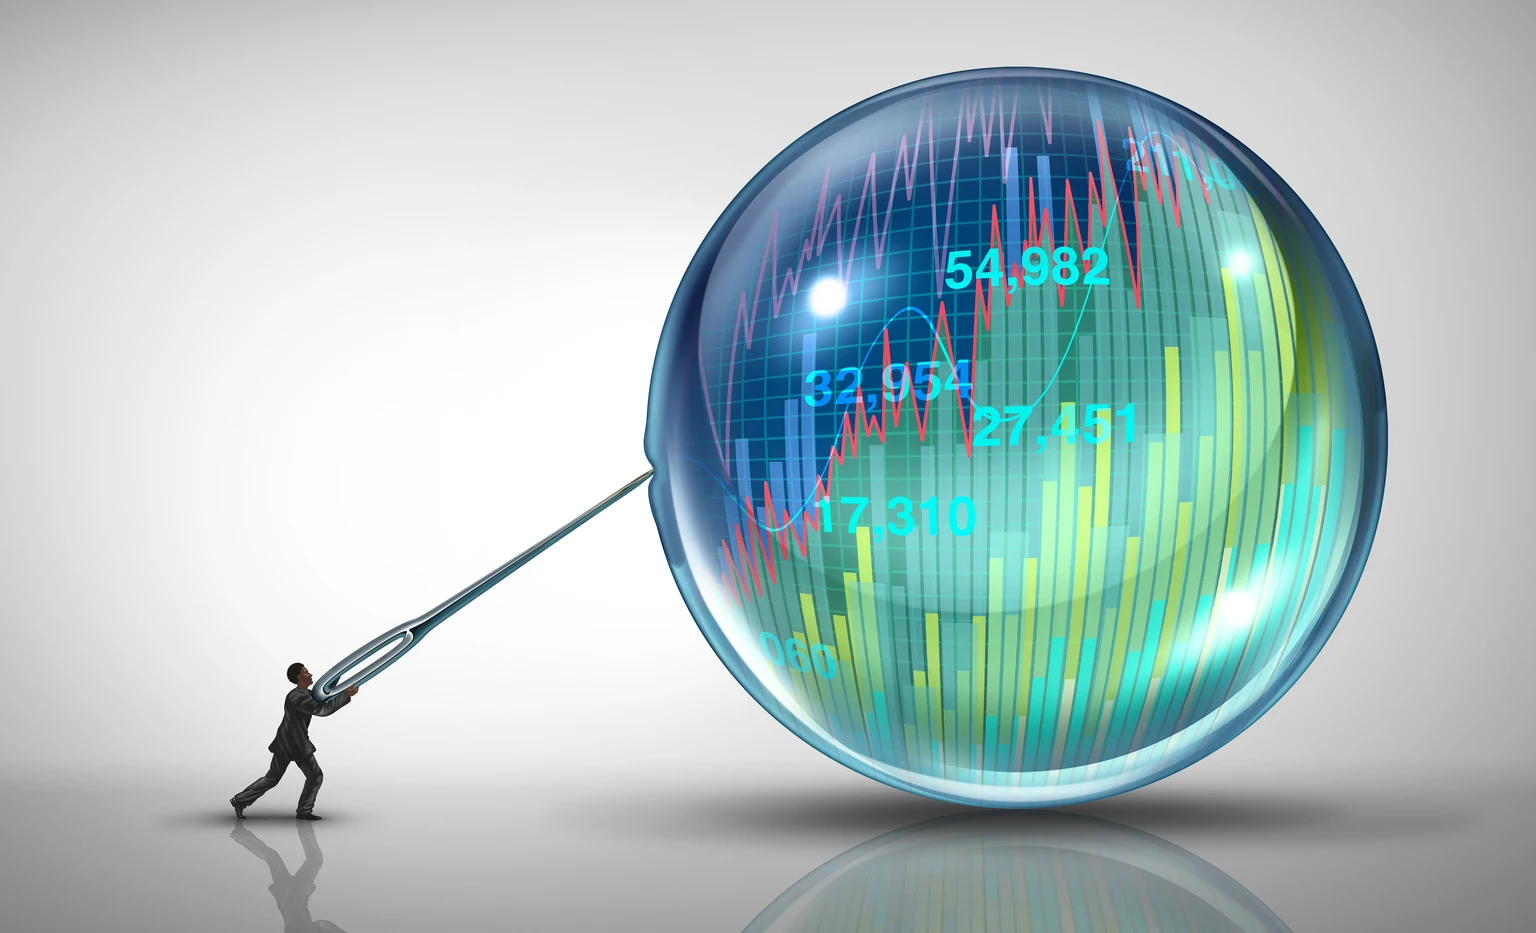
Tariffs are effectively a tax on U.S. consumption, potentially slowing growth by raising costs for consumers and firms. The S&P 500 is trading with a CAPE ratio above 39, a level historically followed by weak returns and drawdowns, a pattern echoing the dot-com crash. While earnings may accelerate in 2025–26, investors are advised to be cautious, consider preserving cash, and tilt portfolios toward long-term wealth rather than chasing volatility.