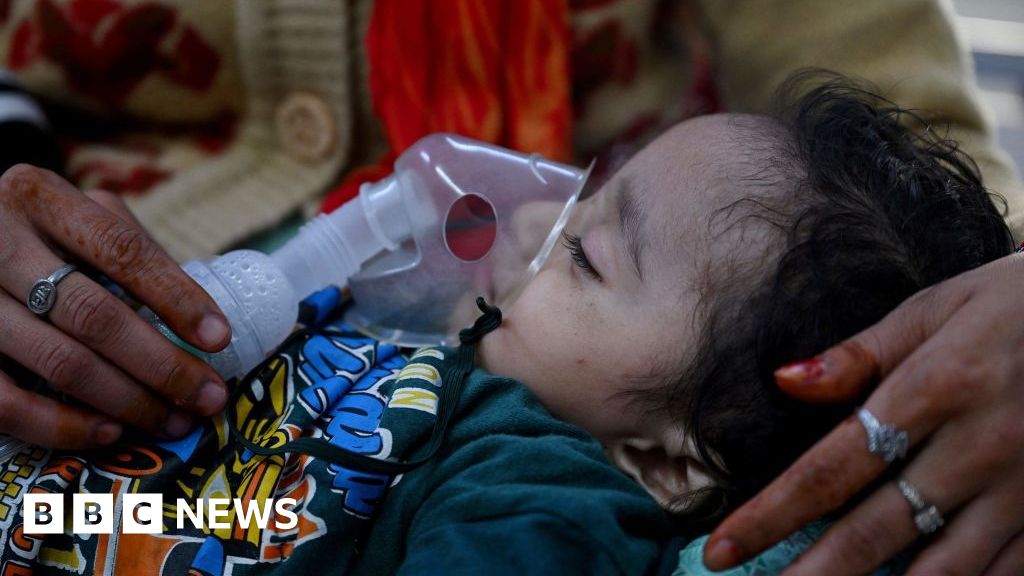
Over 200,000 cases of acute respiratory illnesses were recorded in Delhi's hospitals between 2022 and 2024, linked to toxic air pollution levels that frequently exceed WHO limits, caused by factors like industrial emissions, vehicle exhaust, and crop burning, prompting legal and health concerns.
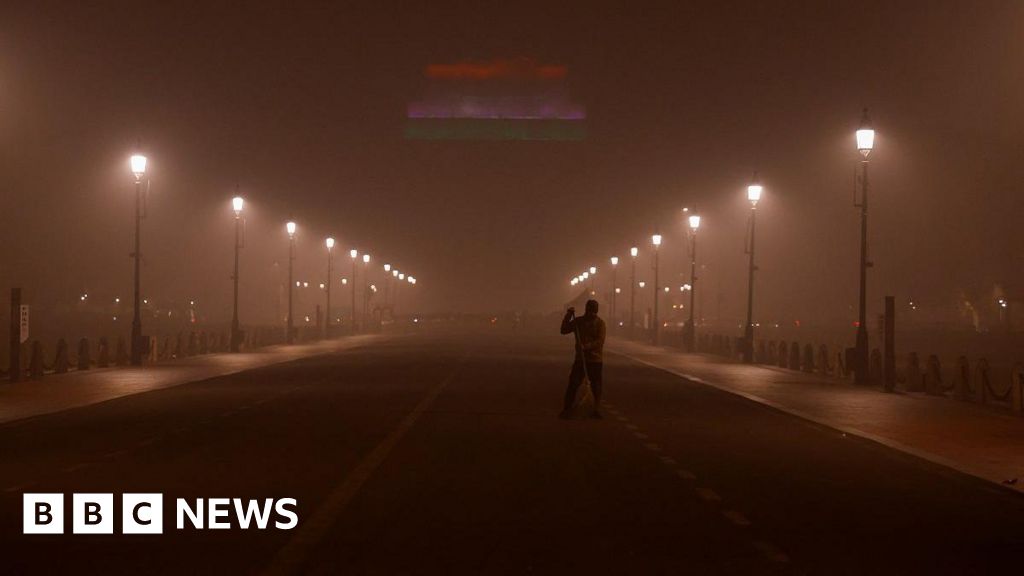
Delhi faces severe air pollution with AQI reaching 425, prompting emergency measures like school closures and work-from-home advisories, amid protests and health warnings for vulnerable populations, highlighting ongoing environmental and public health challenges.
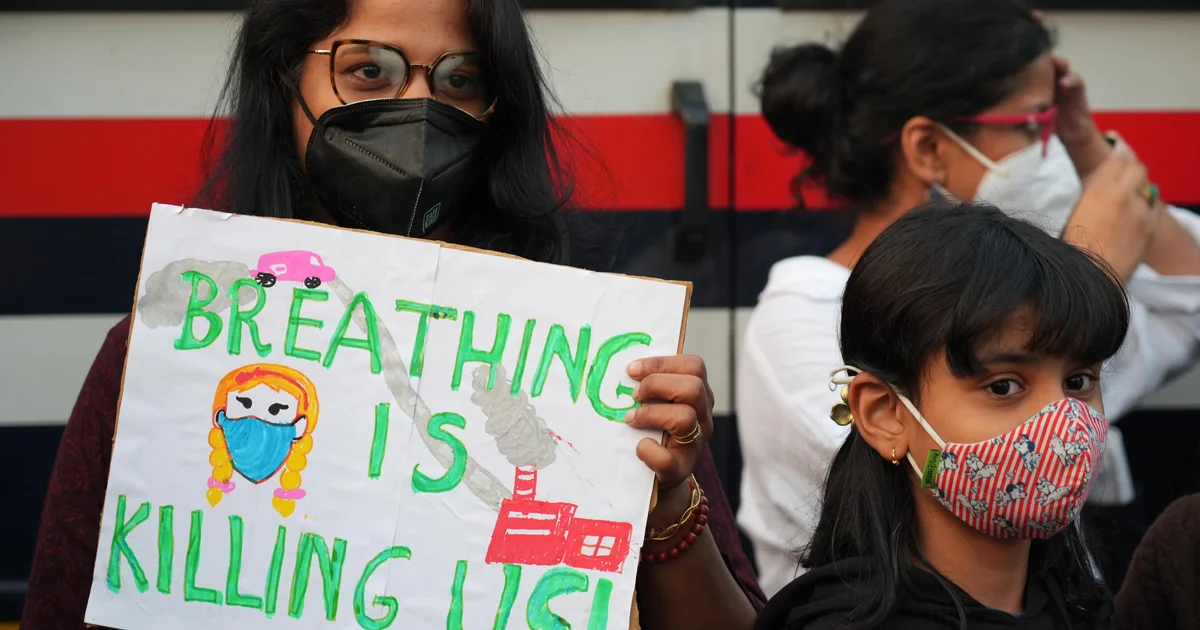
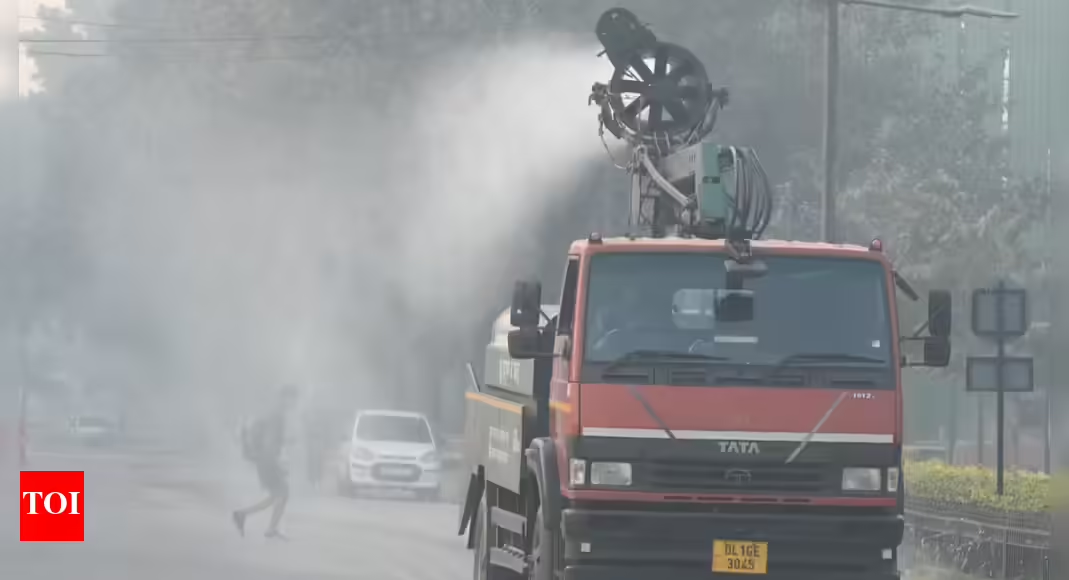
Hundreds protested in Delhi against severe air pollution, with AQI levels reaching hazardous levels, demanding government action. Despite measures like water sprinkling and anti-smog guns, pollution remains critical, prompting calls for declaring a health emergency and stricter enforcement of pollution control plans.
Delhi's air quality continues to worsen, nearing 'severe' levels with an AQI of 370, driven by very poor air quality days, wind changes, and farm fire impacts, prompting ongoing monitoring and measures to improve air quality.
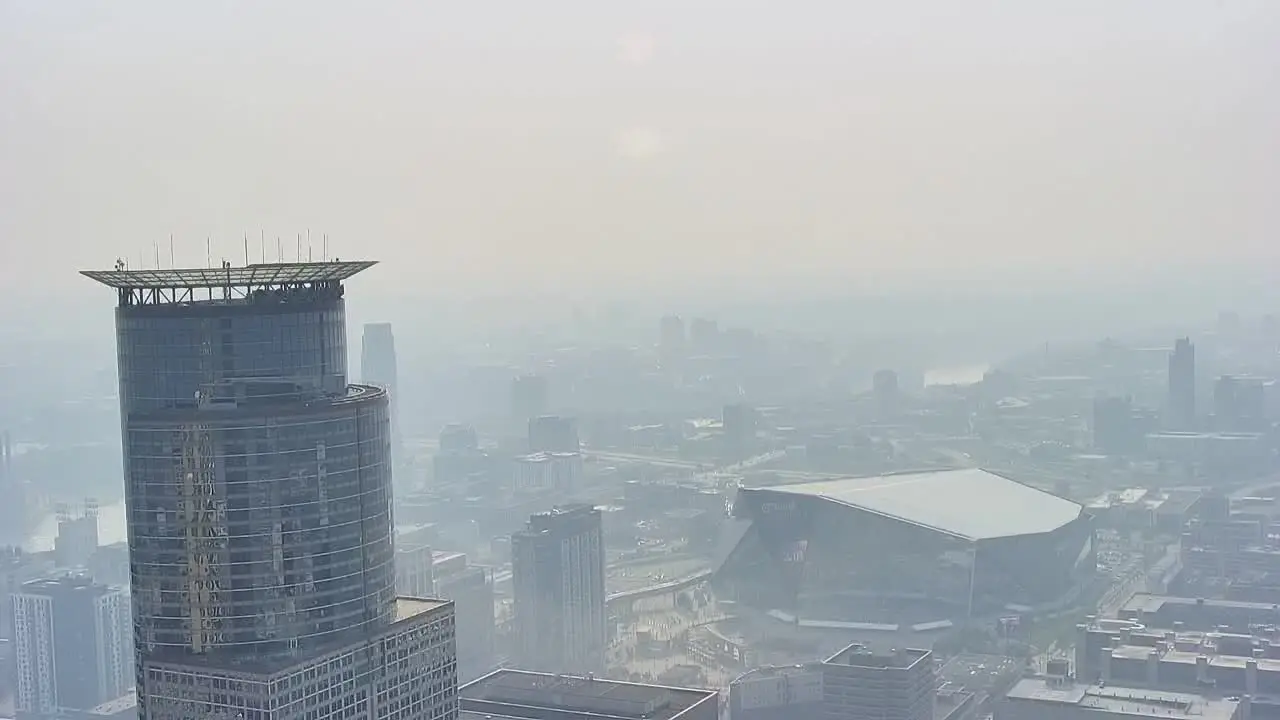
Minneapolis experiences some of the worst air quality in the world due to lingering wildfire smoke from Canada, with an AQI of 159, prompting a statewide air quality alert and health advisories as smoke impacts the region through August 2, 2025.
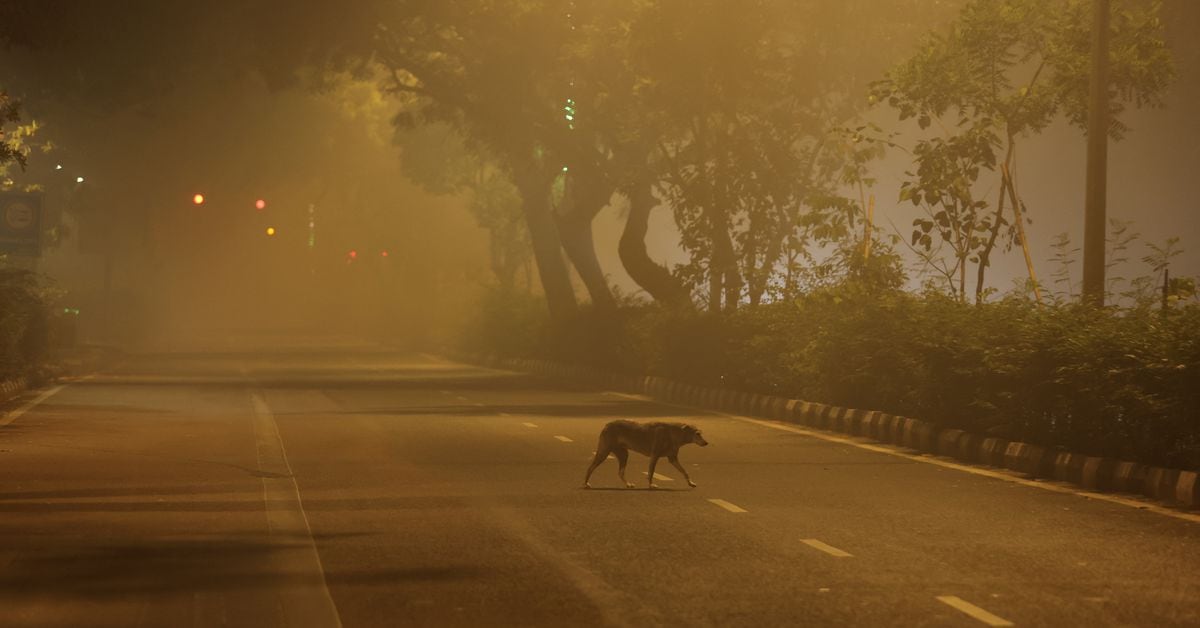
Delhi's air pollution has reached 'severe plus' levels, with AQI readings hitting 1,500, far exceeding the WHO's safe breathing threshold. The toxic smog has led to school closures, flight disruptions, and a ban on construction work. Authorities have also restricted non-essential truck entry and urged remote work for 50% of office staff. The crisis, exacerbated by stubble burning in neighboring states, has sparked political blame between the AAP and BJP, while residents suffer from hazardous air quality.
Google Maps for Android now displays weather and air quality information, including temperature, AQI, and upcoming precipitation, in a small rectangular box on the map layer. Tapping on the box reveals more detailed weather information and a 12-hour forecast. This feature, previously available on iOS, is now rolling out to Android users and will update as users move around the map.
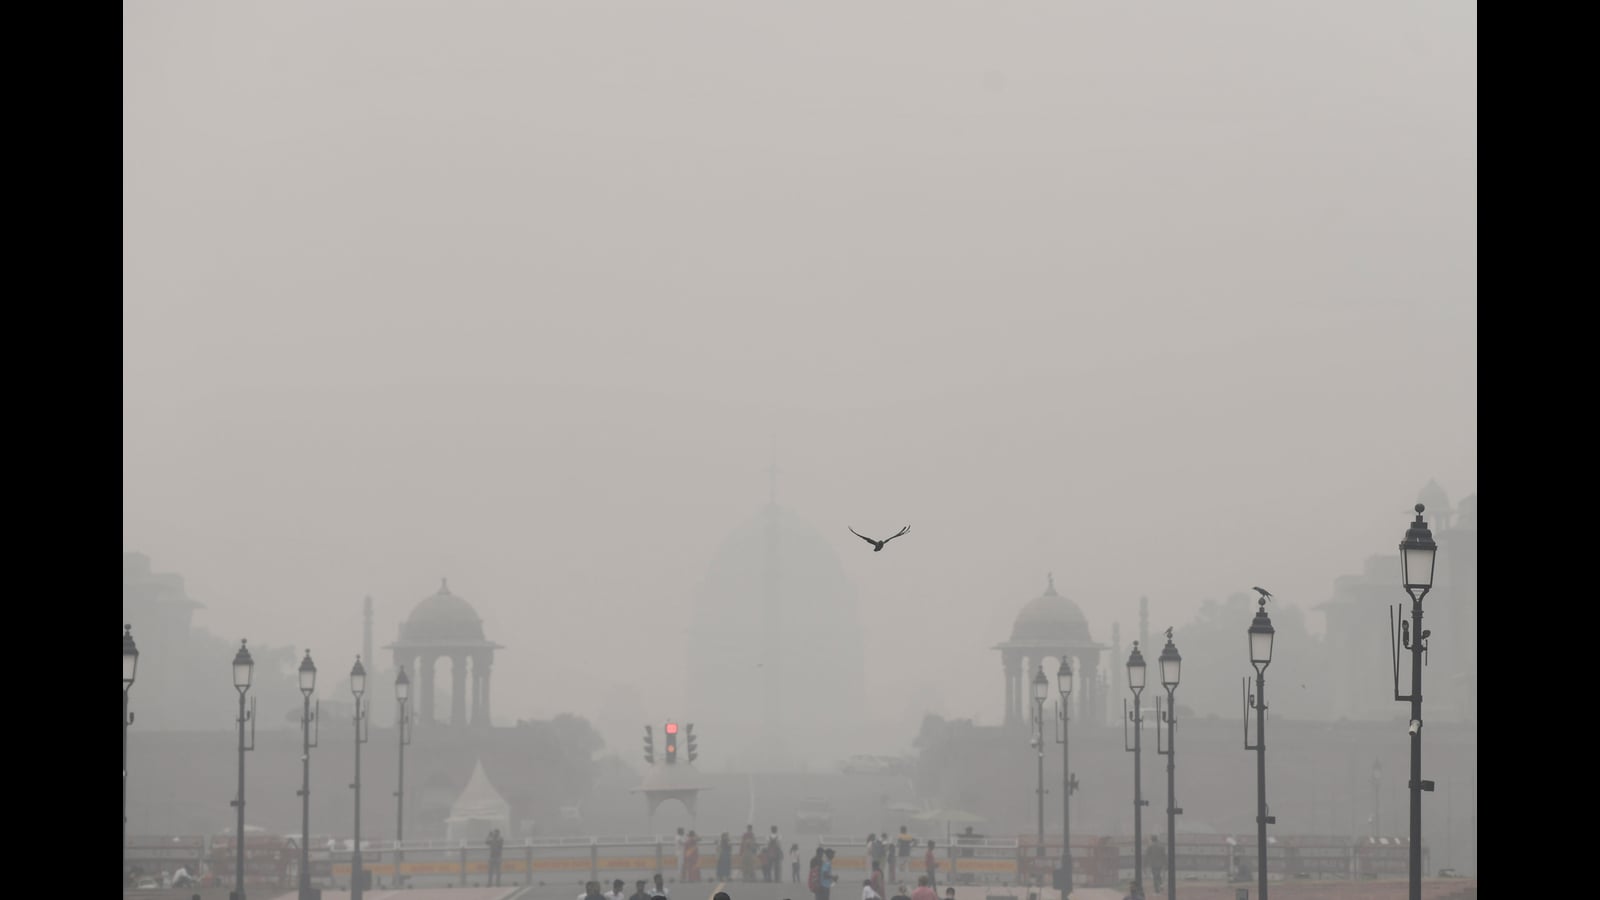
Two Indian cities, Mumbai and Kolkata, have joined New Delhi in the list of the world's top 10 most polluted cities after Diwali celebrations, with New Delhi taking the top spot. The air quality index (AQI) in New Delhi reached a hazardous level of 407, while Mumbai and Kolkata recorded AQI figures of 157 and 154 respectively. The smog and pollution in these cities pose health risks, particularly to those with existing respiratory conditions. Despite bans on firecrackers, enforcement remains lax, contributing to the worsening air quality. The local government plans to maintain restrictions on construction activities and school closures to protect people from the pollution.
Delhi-NCR continues to suffer from severe air pollution, with the air quality index (AQI) remaining in the "severe" category for the third consecutive day. Weather agencies predict that the pollution levels will persist for the next three days. The city recorded an AQI of 415 on Saturday, with 23 out of 34 pollution monitoring stations in the "severe" category. Stubble burning, calm winds, and low temperatures are contributing to the hazardous air quality. The Delhi government has called for a ban on polluting vehicles and a meeting with the environment ministers of neighboring states. However, no significant action has been taken to address the crisis, and the blame game between political parties continues.
As air quality becomes a growing concern due to factors like forest fires, there are several apps available to help monitor local air quality. These apps, such as AirNow, IQAir, Plume Labs, AirCare, and Breezometer, provide real-time data on air quality index (AQI) ratings, forecasts, and pollutant information. While the accuracy of the ratings may vary, these apps offer color-coded AQI ratings to guide users on the health of the air around them. Users can access data from government monitoring agencies, privately owned sensors, or a combination of both. It's important to note that these apps serve as guidelines, and individual needs and sensitivities should be taken into account when interpreting the data.