"Nasdaq's Selling Spree: Microsoft Stock's Bullish Chart Pattern Under Scrutiny"
TL;DR Summary
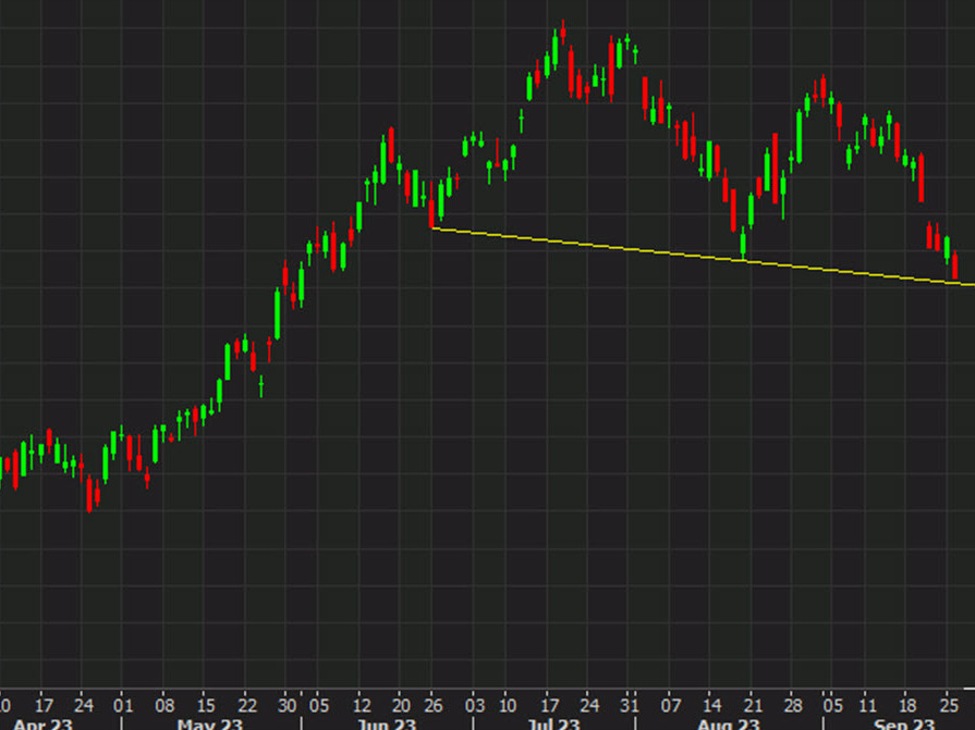
There are two reasons why selling in the Nasdaq could escalate. Firstly, fund managers may opt to close the books for the year and invest in three-month Treasury bills, which currently yield 5.48% annually, to secure their gains and be ready for 2024. Secondly, technical analysis suggests a potential head-and-shoulders pattern forming in the S&P 500 and Nasdaq Composite, with a measured target close to a 6.4% decrease. If the neckline slope on the Nasdaq doesn't hold, heavy selling in megacap tech stocks could occur as the allure of the AI trade diminishes.
Reading Insights
Total Reads
0
Unique Readers
0
Time Saved
1 min
vs 2 min read
Condensed
71%
320 → 93 words
Want the full story? Read the original article
Read on ForexLive